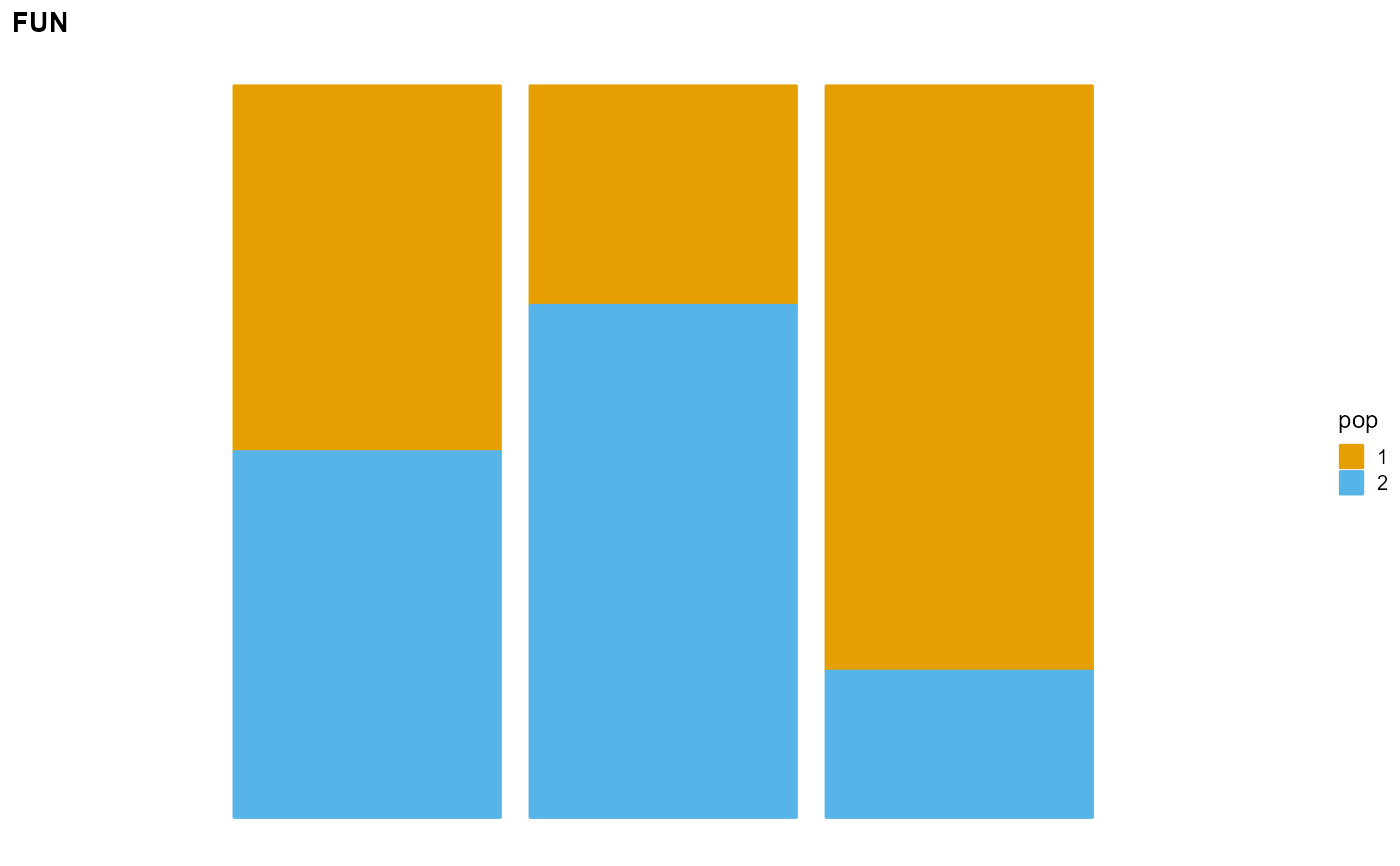
Plot the population proportion of individuals using package ggplot2.
Usage
plot_structure(
  P,
  pops = NULL,
  label = NULL,
  map.indiv = NULL,
  map.pop = NULL,
  gap = NULL,
  colors = c("#E69F00", "#56B4E9", "#009E73", "#F0E442", "#0072B2", "#EE2C2C", "#CC79A7",
    "#8968CD", "#FF83FA", "#EECFA1", "#A52A2A", "#4169E1", "#FFFF00", "#BFEFFF",
    "#FF1493"),
  font.size = 9,
  title = NULL,
  subtitle = NULL
)
Arguments
- P
The proportion matrix.
- pops
Population order options.
- label
The original order of individuals. This option is only for data that needs to be grouped.
- map.indiv
The new order of individuals. This option is only for data that needs to be grouped.
- map.pop
The order of populations. This option is only for data that needs to be grouped.
- gap
Gaps between groups. This option is only for data that needs to be grouped.
- colors
Theme color options.
- font.size
Font size used in plot.
- title
Title of the plot, such as "EM", "SQP", "VI", "SVI".
- subtitle
Subtitle of the plot, such as "K = 2", "K = 3".