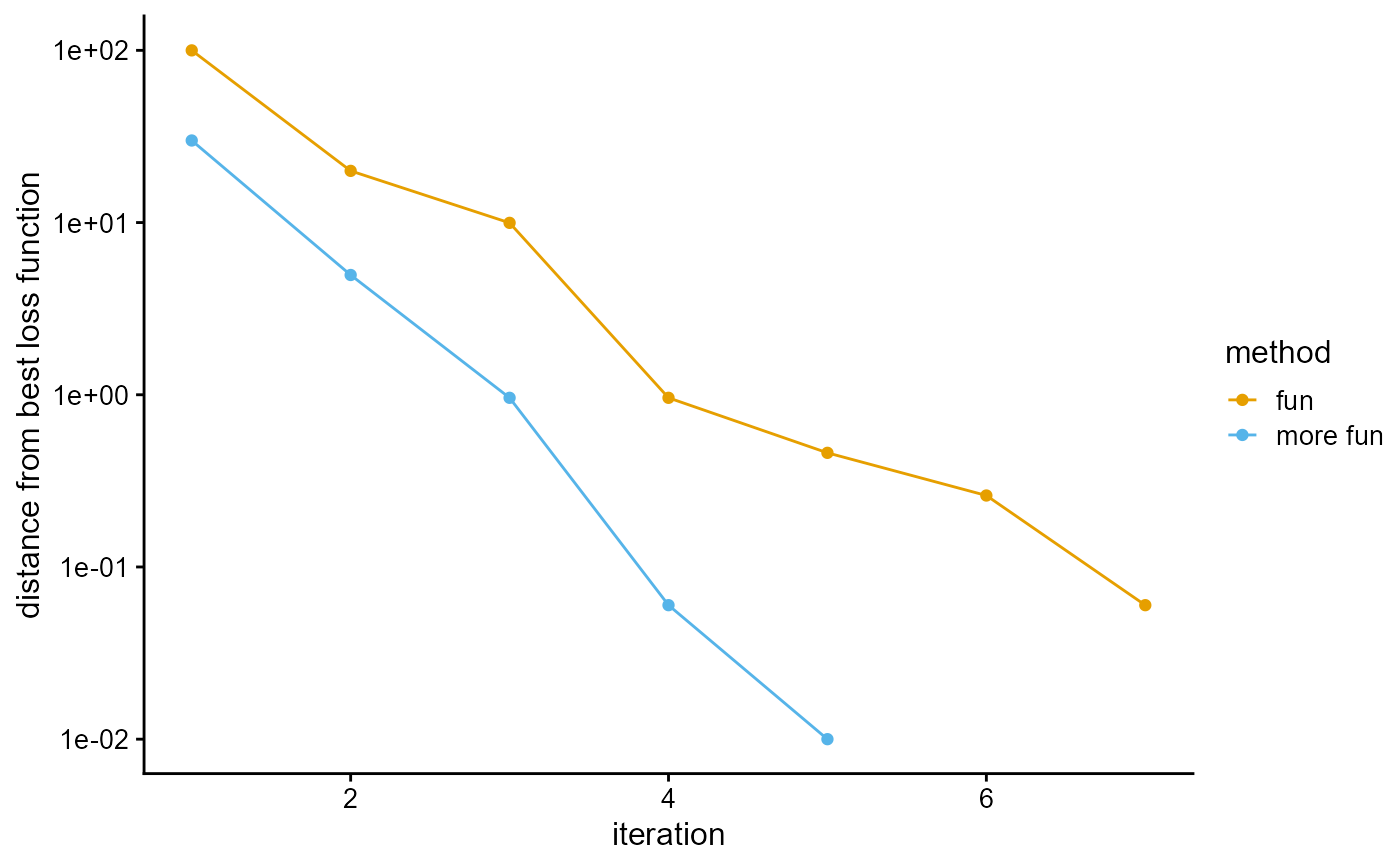
Plot the loss function against the number of iterations using package ggplot2.
Usage
plot_loss(
  L,
  methods,
  sample.rate,
  epsilon = 0.01,
  colors = c("#E69F00", "#56B4E9", "#009E73", "#F0E442", "#0072B2", "#D55E00", "#CC79A7"),
  linetypes = "solid",
  linesizes = 0.5,
  shapes = 19,
  fills = "white",
  theme = function() theme_cowplot(12),
  title = NULL
)
Arguments
- L
A list where each element is a vector of loss functions with respect to the number of iterations.
- methods
A vector of the same length as
Lwhere each element is a name of the fitting algorithm, such as "em", "sqp", "vi", "svi".- sample.rate
The sampling rate of the loss function.
- epsilon
A small, positive number added to the vertical axis so that the logarithmic scale does not over-emphasize very small differences.
- colors
The colors used to draw loss curves.
- linetypes
The line types used to draw loss curves.
- linesizes
The line sizes used to draw loss curves.
- shapes
The shapes used to draw points at iterations.
- fills
The fill colors used to draw points at iterations.
- theme
The ggplot2 theme.
- title
Title of the plot, such as "K = 2", "K = 3".