Draw a diagram of the relationship between the index and K using package ggplot2. The index can be loglikelihood, error, ELBO, and time.
Usage
plot_index_vs_K(
  L,
  methods,
  index.id = c("loglik", "error", "elbo", "time"),
  start.point = 2,
  colors = c("#E69F00", "#56B4E9", "#009E73", "#F0E442", "#0072B2", "#D55E00", "#CC79A7"),
  linetypes = "solid",
  linesizes = 0.5,
  shapes = 19,
  fills = "white",
  theme = function() theme_cowplot(12),
  title = NULL
)
Arguments
- L
A list where each element is a vector of index with respect to K.
- methods
A vector of the same length as
Lwhere each element is a name of the fitting algorithm, such as "em", "sqp", "vi", "svi".- index.id
Choose index. Should be one of
"loglik","error","elbo","time".- start.point
The initial point of K.
- colors
The colors used to draw curves.
- linetypes
The line types used to draw curves.
- linesizes
The line sizes used to draw curves.
- shapes
The shapes used to draw points.
- fills
The fill colors used to draw points.
- theme
The ggplot2 theme.
- title
Title of the plot.
Examples
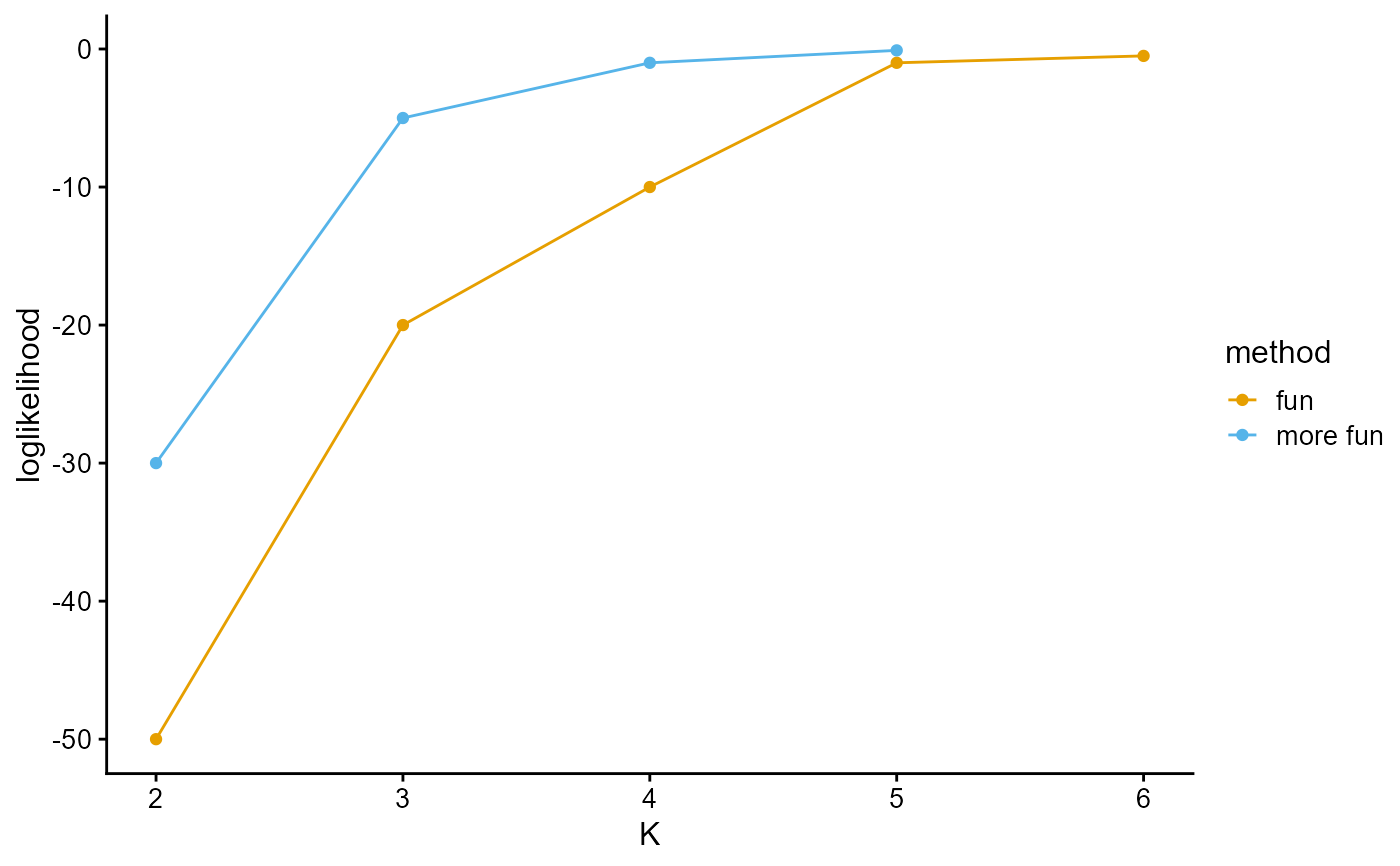
L <- list(c(-50,-20,-10,-1,-0.5), c(-30,-5,-1,-0.1))
plot_index_vs_K(L, c("fun","more fun"), index.id = "loglik")
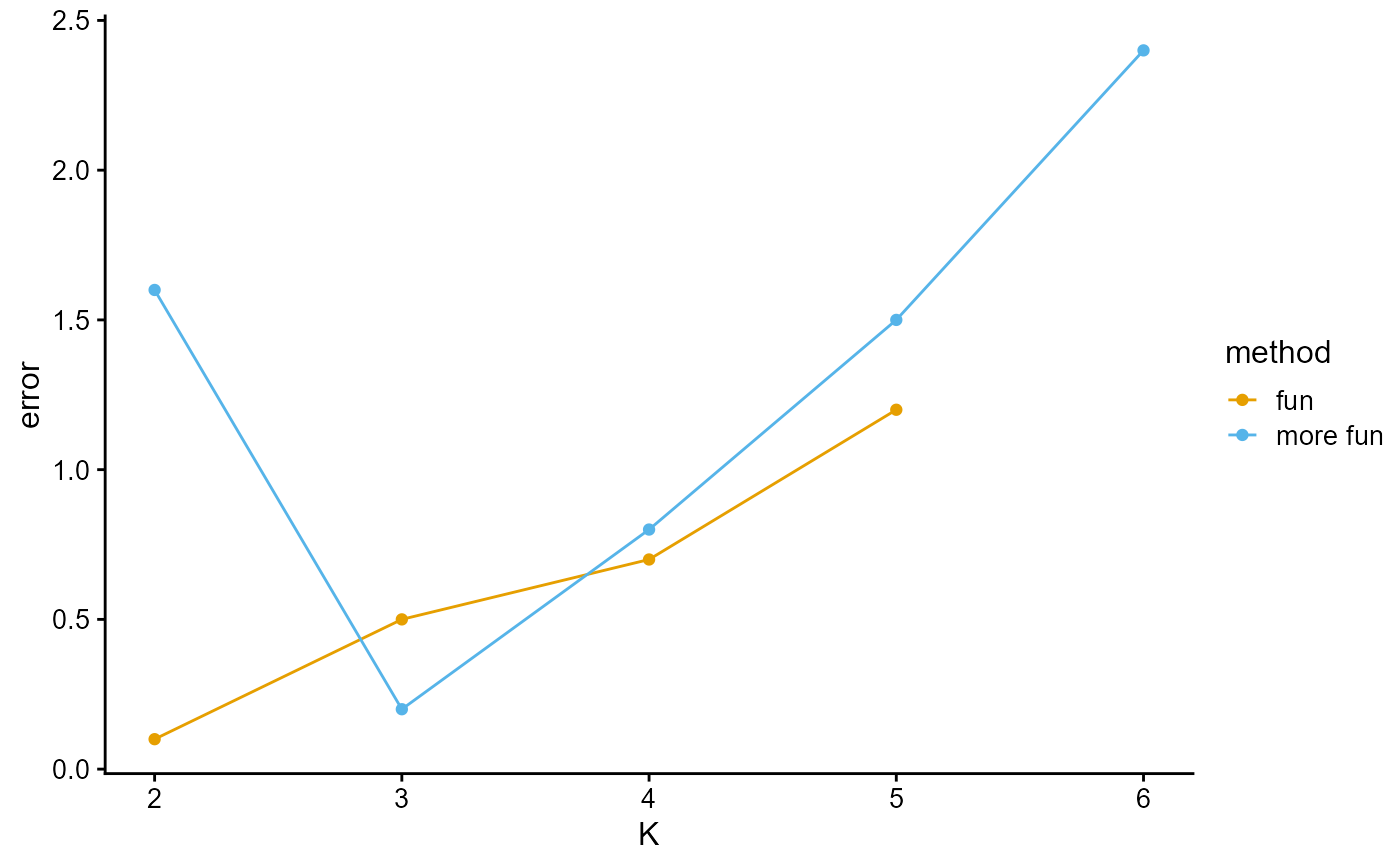
 L <- list(c(0.1,0.5,0.7,1.2), c(1.6,0.2,0.8,1.5,2.4))
plot_index_vs_K(L, c("fun","more fun"), index.id = "error")
L <- list(c(0.1,0.5,0.7,1.2), c(1.6,0.2,0.8,1.5,2.4))
plot_index_vs_K(L, c("fun","more fun"), index.id = "error")
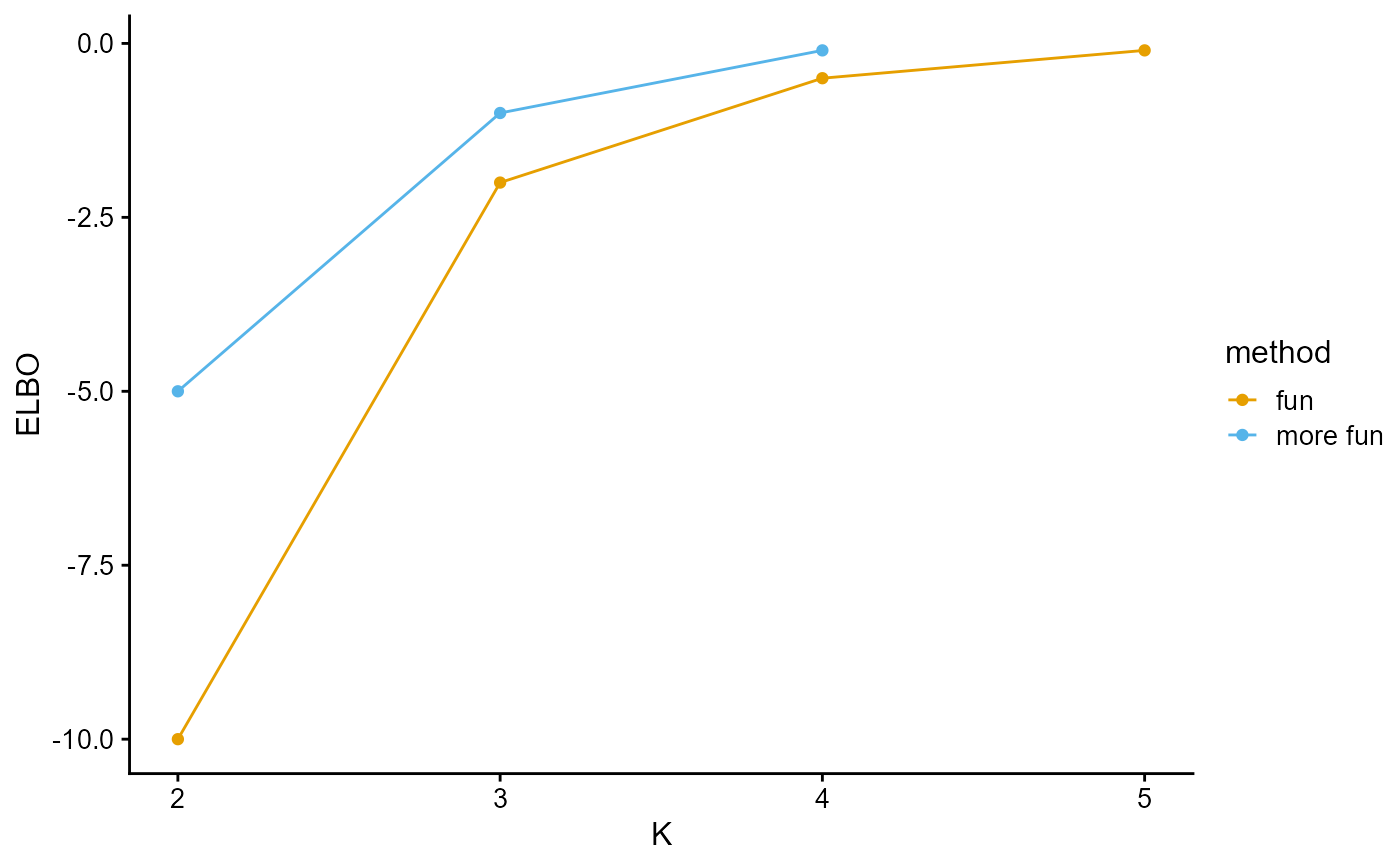
 L <- list(c(-10,-2,-0.5,-0.1), c(-5,-1,-0.1))
plot_index_vs_K(L, c("fun","more fun"), index.id = "elbo")
L <- list(c(-10,-2,-0.5,-0.1), c(-5,-1,-0.1))
plot_index_vs_K(L, c("fun","more fun"), index.id = "elbo")
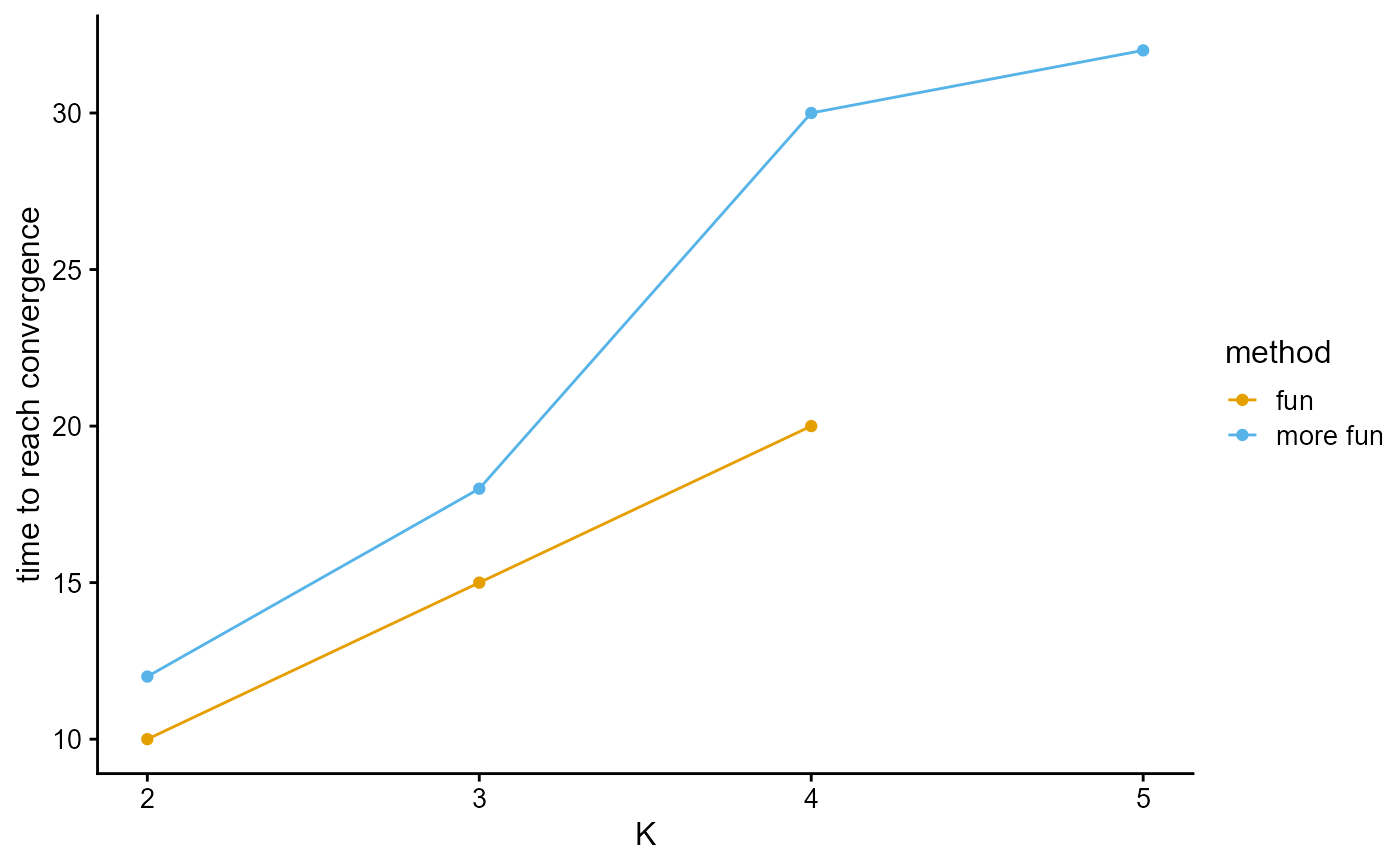
 L <- list(c(10,15,20), c(12,18,30,32))
plot_index_vs_K(L, c("fun","more fun"), index.id = "time")
L <- list(c(10,15,20), c(12,18,30,32))
plot_index_vs_K(L, c("fun","more fun"), index.id = "time")